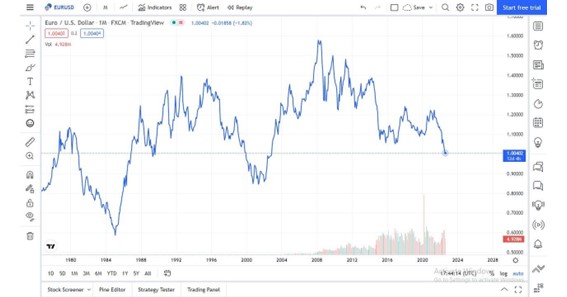
Support and resistance levels are important for technical analysis forex traders use to identify potential price reversals. Most trading strategies incorporate support and resistance to maximize trading performance. It is imperative to understand how support and resistance levels are formed, how they impact price movement, and how to draw them will help traders improve their trading decisions is imperative. No special tools are needed to identify and remove support and resistance levels; most brokers provide basic and advanced tools such as trendlines.
This article explores everything you need to know about identifying, drawing, and deploying support and resistance levels on any trading platform. With this knowledge, you can easily find good entries and exits for your trades.
History of support and resistance level
The conception and use of support and resistance analysis can be traced back to the early days of financial markets. The concept emerged from the observation that certain price levels act as psychological barriers for traders. These levels are where buyers and sellers have historically shown a willingness to enter or exit trades, causing the price to reverse or consolidate. Upon observation, traders could predict where prices may stop before increasing or decreasing, depending on the current trend. For example, commodity traders could predict the seasonal prices of foodstuffs within a range based on the current season and conditions. The concept soon found practical uses in currency trading and was quickly adopted to technical analysis. Support and resistance levels help analysis on any trading platform.
What is a support level?
The concept of support is closely linked to the idea of demand in the market. A supply level is a price level where the value of a currency pair falls to the demand level, and traders feel confident about buying the currency pair at an undervalued price. When such a demand level is tested continuously, it becomes a support level.
A support level is a lower region where the price keeps ‘bouncing’ off, reversing its direction when it reaches there. The support level shows how low the sellers are willing to go before the buyers step in to push the price higher. Traders watch out for key support levels because they help identify key price levels and potentially profitable setups. How do traders identify support levels?
What is a resistance level?
A resistance level is higher when the price reaches excess supply, and the asset is overvalued. When this happens, traders tend to take a sell entry, expecting the price to fall. As bulls push the price of a currency pair, it reaches a supply zone where traders are unwilling to let the price rise beyond. At that level, sellers try to push the price lower but keep testing the upper limit.
If the retests continue and the level supply holds, it becomes a resistance level where the price “bounces off” and reverses. Resistance is similar to support levels in that it helps traders identify key demand and supply price levels and potential price reversals. This is key to making better trading decisions.
How to identify support and resistance levels
Support levels are apparent in trending markets with a clear direction, where price moves between upper and lower limits. Experienced traders can identify the support price even before using any technical tool.
Traders find support and resistance in any of the three types of market structure; bullish, bearish, and ranging markets.
Some of the most common methods include:
- Using historical price data: this involves looking at historical price charts to identify price levels where the price has previously bounced off at higher and lower levels.
- Using trendlines: this is a line that connects two or more points on a price chart. Trendlines can be used to identify support and resistance levels.
- Using Fibonacci retracements: these are a set of ratios that traders use for various purposes, including identifying potential support and resistance levels.
Features of support and resistance
Here are some key features to remember about support and resistance levels:
- Support and resistance levels are dynamic. They can change over time, depending on market conditions. For example, a support level held for several weeks may eventually break if the market sentiment changes. A previous support level can become a new resistance level and vice-versa.
This is quite common in trending markets that absorb the impact of fundamental data, such as an interest rate increase.
- Support and resistance levels are only sometimes perfect. The price may not always respect support and resistance levels. However, the more times a price level has been tested and held, the more likely it is to hold again.
- Support and resistance levels can be used to identify potential trading opportunities. Most strategies are based on identifying the underlying asset’s significant support and resistance levels.
Trading strategies using support and resistance
Swing, range, trend, and breakout trading are some strategies that rely on support and resistance levels. When traders identify the critical price levels with potential price reversals, they can find good entries and exits for their trades.
For example, a trader looking for a breakout trade will identify the support and resistance level and then wait for the price to break below or above, respectively. If the breakout happens and the price retests more than three times, the trader can enter a trade. This is an excellent way to catch a continuation or reversal trend.
Support and resistance levels are also helpful in calculating Stop Loss and Take Profit prices which are crucial to proper fund management.
Conclusion
The support and resistance levels help traders to read charts across markets easily. As a forex trader, familiarize yourself with your trading platform and identify the critical price levels where support and resistance may form. Use the historical chart to identify the major levels on a higher timeframe and then find the correct entries on lower time frames. This tip can hone your entries and help maximize your trading performance.

